In a previous post, I tried to persuade you that synthesising evidence is a good idea for development. But everyone knows that busy policy makers are unlikely to read 100 page long evidence synthesis products. So what are the key messages that you need to convey from a synthesis product and how can you present these? Or in other words, how can you summarise your synthesis? Here are a few top tips…
1. Make it short… and make it pretty
There is a myth that intelligent people should be able to wade through longer documents and that aesthetics are beneath them. Codswallop, I say. People, whether intelligent or less so, love a nice picture and some attractive formatting. So if you want to get your message across, I suggest getting in touch with your inner artist. For the best quality products, you may want to teach yourself to use a desktop publishing software – Scribus is open source and pretty easy to learn to use. Alternatively, you can create very attractive short documents using templates and styles on Word. Whichever programme you use, make sure you have a nice palette – some great ideas can be found here. And if you are using pictures, keep it legal by using creative commons licenced pictures (you can search for them on Flickr or check out the marvelous morguefile) and attributing correctly.
2. Be explicit about your methodology
Policy makers who are serious about evidence-informed decision makers are not going to believe that the evidence says something just because you say it does. They will need to be convinced that those writing the synthesis used an appropriate methodology to find, select and draw meaning from the evidence – so make sure you tell them what that was in your summary. This doesn’t mean that every evidence synthesis needs to use systematic review methodology – sometimes that will not be appropriate or practical – it just means that you need to be open about the approach(es) that were used.
3. Provide a list of - and if possible hyperlinks to – references
Evidence diagrams can help policy makers understand the ‘lay of the land’ of evidence but policy makers may want to delve deeper into the evidence on a particular theme or area. So, even in a summary of synthesised evidence, DO provide references (use a numbered reference style so they don’t take up too much space in the text).
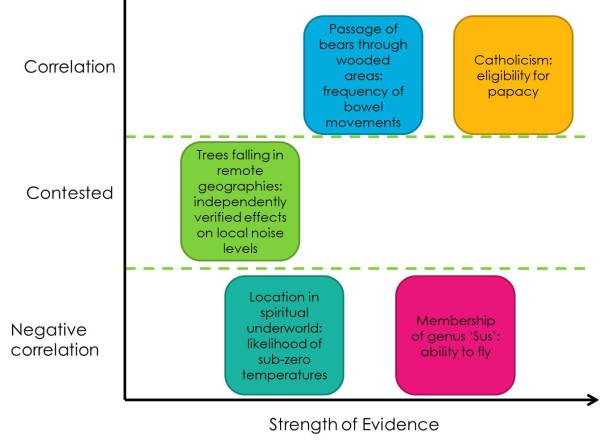
4. Provide an easy to understand overview of the weight of evidence
Policy makers need to get an understanding of not just how much evidence there is, but also what the quality of the research results are so that they know how much faith to put in them. When you carry out your synthesis, it will be important to use an appropriate method to appraise the quality of the evidence. See for example the GRADE method for assessing health research or this how-to note from DFID which can be used for social science research. And when you communicate your findings, it is important that you convey this as well. An effective way to do this is to use a bubble diagram which gives an easy to understand overview of what the evidence says and how strong the evidence is. A beautiful example of this illustrating the evidence for various food supplements can be found here and a rather less serious one, blatantly stolen from my colleague @evidencebroker, can be viewed below.
There is usually a lot less evidence to synthesise in development research but similar diagrams can be generated – see for example this DFID ‘Evidence brief’ or page 43 of this paper.